| Record Information |
|---|
| Version | 1.0 |
|---|
| Creation Date | 2016-09-30 22:49:44 UTC |
|---|
| Update Date | 2020-06-04 22:47:07 UTC |
|---|
| BMDB ID | BMDB0002000 |
|---|
| Secondary Accession Numbers | |
|---|
| Metabolite Identification |
|---|
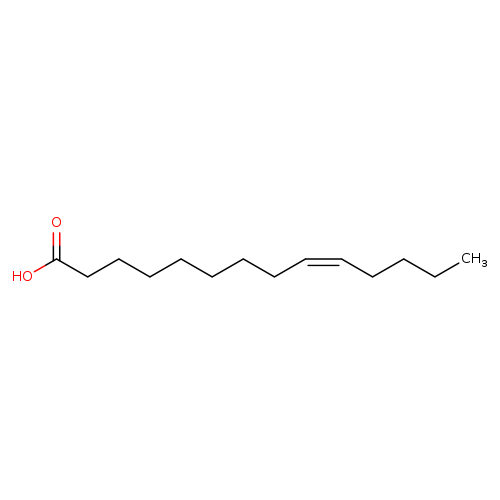
| Common Name | Myristoleic acid |
|---|
| Description | Myristoleic acid, also known as 9-tetradecenoate or myristoleate, belongs to the class of organic compounds known as long-chain fatty acids. These are fatty acids with an aliphatic tail that contains between 13 and 21 carbon atoms. Myristoleic acid is a very hydrophobic molecule, practically insoluble (in water), and relatively neutral. Myristoleic acid exists in all eukaryotes, ranging from yeast to humans. |
|---|
| Structure | |
|---|
| Synonyms | | Value | Source |
|---|
| (9Z)-Tetradecenoic acid | ChEBI | | (Z)-Tetradec-9-enoic acid | ChEBI | | 9-Tetradecenoic acid | ChEBI | | 9Z-Tetradecenoic acid | ChEBI | | cis-9-Tetradecenoic acid | ChEBI | | cis-Delta(9)-Tetradecenoic acid | ChEBI | | cis-Tetradec-9-enoic acid | ChEBI | | (9Z)-Tetradecenoate | Generator | | (Z)-Tetradec-9-enoate | Generator | | 9-Tetradecenoate | Generator | | 9Z-Tetradecenoate | Generator | | cis-9-Tetradecenoate | Generator | | cis-delta(9)-Tetradecenoate | Generator | | cis-Δ(9)-tetradecenoate | Generator | | cis-Δ(9)-tetradecenoic acid | Generator | | cis-Tetradec-9-enoate | Generator | | Myristoleate | Generator | | (9Z)-Tetradec-9-enoate | HMDB | | (9Z)-Tetradec-9-enoic acid | HMDB | | (9Z)-9-Tetradecenoic acid | HMDB | | (Z)-9-Tetradecenoic acid | HMDB | | 9(Z)-Tetradecenoic acid | HMDB | | 9-cis-Tetradecenoic acid | HMDB | | FA(14:1(9Z)) | HMDB | | FA(14:1n5) | HMDB | | Myristoleic acid | HMDB | | Myristolenic acid | HMDB | | Oleomyristic acid | HMDB | | cis-delta9-Tetradecenoic acid | HMDB | | cis-Δ9-Tetradecenoic acid | HMDB |
|
|---|
| Chemical Formula | C14H26O2 |
|---|
| Average Molecular Weight | 226.355 |
|---|
| Monoisotopic Molecular Weight | 226.193280076 |
|---|
| IUPAC Name | (9Z)-tetradec-9-enoic acid |
|---|
| Traditional Name | myristoleic acid |
|---|
| CAS Registry Number | 544-64-9 |
|---|
| SMILES | CCCC\C=C/CCCCCCCC(O)=O |
|---|
| InChI Identifier | InChI=1S/C14H26O2/c1-2-3-4-5-6-7-8-9-10-11-12-13-14(15)16/h5-6H,2-4,7-13H2,1H3,(H,15,16)/b6-5- |
|---|
| InChI Key | YWWVWXASSLXJHU-WAYWQWQTSA-N |
|---|
| Chemical Taxonomy |
|---|
| Description | belongs to the class of organic compounds known as long-chain fatty acids. These are fatty acids with an aliphatic tail that contains between 13 and 21 carbon atoms. |
|---|
| Kingdom | Organic compounds |
|---|
| Super Class | Lipids and lipid-like molecules |
|---|
| Class | Fatty Acyls |
|---|
| Sub Class | Fatty acids and conjugates |
|---|
| Direct Parent | Long-chain fatty acids |
|---|
| Alternative Parents | |
|---|
| Substituents | - Long-chain fatty acid
- Unsaturated fatty acid
- Straight chain fatty acid
- Monocarboxylic acid or derivatives
- Carboxylic acid
- Carboxylic acid derivative
- Organic oxygen compound
- Organic oxide
- Hydrocarbon derivative
- Organooxygen compound
- Carbonyl group
- Aliphatic acyclic compound
|
|---|
| Molecular Framework | Aliphatic acyclic compounds |
|---|
| External Descriptors | |
|---|
| Ontology |
|---|
| Status | Detected and Quantified |
|---|
| Origin | |
|---|
| Biofunction | Not Available |
|---|
| Application | Not Available |
|---|
| Cellular locations | - Adiposome
- Cell membrane
- Cytoplasm
- Membrane
|
|---|
| Physical Properties |
|---|
| State | Liquid |
|---|
| Experimental Properties | | Property | Value | Reference |
|---|
| Melting Point | Not Available | Not Available | | Boiling Point | Not Available | Not Available | | Water Solubility | Not Available | Not Available | | LogP | Not Available | Not Available |
|
|---|
| Predicted Properties | |
|---|
| Spectra |
|---|
| Spectra | | Spectrum Type | Description | Splash Key | |
|---|
| Predicted GC-MS | Predicted GC-MS Spectrum - GC-MS (Non-derivatized) - 70eV, Positive | splash10-0006-9800000000-71fb52f9fefd5cb3790e | View in MoNA |
|---|
| Predicted GC-MS | Predicted GC-MS Spectrum - GC-MS (1 TMS) - 70eV, Positive | splash10-00a9-9520000000-b85c6ba98a1ce24c3518 | View in MoNA |
|---|
| Predicted GC-MS | Predicted GC-MS Spectrum - GC-MS (Non-derivatized) - 70eV, Positive | Not Available | View in JSpectraViewer |
|---|
| LC-MS/MS | LC-MS/MS Spectrum - LC-ESI-QQ , negative | splash10-004i-0090000000-57b079c6d11a9714cb51 | View in MoNA |
|---|
| LC-MS/MS | LC-MS/MS Spectrum - LC-ESI-QQ , negative | splash10-004i-0090000000-4fcda40660e1f5947eb6 | View in MoNA |
|---|
| LC-MS/MS | LC-MS/MS Spectrum - LC-ESI-QQ , negative | splash10-0a4i-9120000000-50121015a2477be41bec | View in MoNA |
|---|
| LC-MS/MS | LC-MS/MS Spectrum - LC-ESI-QQ , negative | splash10-0595-9000000000-98c3d58fb9e1e7c41c90 | View in MoNA |
|---|
| LC-MS/MS | LC-MS/MS Spectrum - LC-ESI-IT , negative | splash10-004i-0090000000-e588f40ae851251aee81 | View in MoNA |
|---|
| Predicted LC-MS/MS | Predicted LC-MS/MS Spectrum - 10V, Positive | splash10-056r-0390000000-6a2bf4ff780562d5fdd9 | View in MoNA |
|---|
| Predicted LC-MS/MS | Predicted LC-MS/MS Spectrum - 20V, Positive | splash10-00lr-6930000000-bd53c7ac25c8930728e7 | View in MoNA |
|---|
| Predicted LC-MS/MS | Predicted LC-MS/MS Spectrum - 40V, Positive | splash10-052f-9300000000-cd017bd3efd7fa06ee6e | View in MoNA |
|---|
| Predicted LC-MS/MS | Predicted LC-MS/MS Spectrum - 10V, Negative | splash10-004i-0190000000-c6a068748e37ad83d1d8 | View in MoNA |
|---|
| Predicted LC-MS/MS | Predicted LC-MS/MS Spectrum - 20V, Negative | splash10-0059-1590000000-999dd13c5871dbb32a3f | View in MoNA |
|---|
| Predicted LC-MS/MS | Predicted LC-MS/MS Spectrum - 40V, Negative | splash10-0a4i-9400000000-97121a85c8e202172ecf | View in MoNA |
|---|
| Predicted LC-MS/MS | Predicted LC-MS/MS Spectrum - 10V, Negative | splash10-004i-0090000000-6c6d923a7644bf907b73 | View in MoNA |
|---|
| Predicted LC-MS/MS | Predicted LC-MS/MS Spectrum - 20V, Negative | splash10-056r-1090000000-bf30a380076470239567 | View in MoNA |
|---|
| Predicted LC-MS/MS | Predicted LC-MS/MS Spectrum - 40V, Negative | splash10-0006-9300000000-b037435cdbd96f2e828d | View in MoNA |
|---|
| Predicted LC-MS/MS | Predicted LC-MS/MS Spectrum - 10V, Positive | splash10-0a7j-9330000000-790a04dc9533b3b6607b | View in MoNA |
|---|
| Predicted LC-MS/MS | Predicted LC-MS/MS Spectrum - 20V, Positive | splash10-05o1-9000000000-fa6bdbb819001b908171 | View in MoNA |
|---|
| Predicted LC-MS/MS | Predicted LC-MS/MS Spectrum - 40V, Positive | splash10-0aou-9000000000-aaba2dc5fc19c49556c2 | View in MoNA |
|---|
| MS | Mass Spectrum (Electron Ionization) | splash10-0aou-9100000000-1823acbf402fe87fba5b | View in MoNA |
|---|
| 1D NMR | 13C NMR Spectrum (1D, 100 MHz, H2O, predicted) | Not Available | View in JSpectraViewer |
|---|
| 1D NMR | 1H NMR Spectrum (1D, 100 MHz, H2O, predicted) | Not Available | View in JSpectraViewer |
|---|
| 1D NMR | 13C NMR Spectrum (1D, 1000 MHz, H2O, predicted) | Not Available | View in JSpectraViewer |
|---|
| 1D NMR | 1H NMR Spectrum (1D, 1000 MHz, H2O, predicted) | Not Available | View in JSpectraViewer |
|---|
| 1D NMR | 13C NMR Spectrum (1D, 200 MHz, H2O, predicted) | Not Available | View in JSpectraViewer |
|---|
| 1D NMR | 1H NMR Spectrum (1D, 200 MHz, H2O, predicted) | Not Available | View in JSpectraViewer |
|---|
| 1D NMR | 13C NMR Spectrum (1D, 300 MHz, H2O, predicted) | Not Available | View in JSpectraViewer |
|---|
| 1D NMR | 1H NMR Spectrum (1D, 300 MHz, H2O, predicted) | Not Available | View in JSpectraViewer |
|---|
| 1D NMR | 13C NMR Spectrum (1D, 400 MHz, H2O, predicted) | Not Available | View in JSpectraViewer |
|---|
| 1D NMR | 1H NMR Spectrum (1D, 400 MHz, H2O, predicted) | Not Available | View in JSpectraViewer |
|---|
| 1D NMR | 13C NMR Spectrum (1D, 500 MHz, H2O, predicted) | Not Available | View in JSpectraViewer |
|---|
| 1D NMR | 1H NMR Spectrum (1D, 500 MHz, H2O, predicted) | Not Available | View in JSpectraViewer |
|---|
| 1D NMR | 13C NMR Spectrum (1D, 600 MHz, H2O, predicted) | Not Available | View in JSpectraViewer |
|---|
| 1D NMR | 1H NMR Spectrum (1D, 600 MHz, H2O, predicted) | Not Available | View in JSpectraViewer |
|---|
| 1D NMR | 13C NMR Spectrum (1D, 700 MHz, H2O, predicted) | Not Available | View in JSpectraViewer |
|---|
| 1D NMR | 1H NMR Spectrum (1D, 700 MHz, H2O, predicted) | Not Available | View in JSpectraViewer |
|---|
| 1D NMR | 13C NMR Spectrum (1D, 800 MHz, H2O, predicted) | Not Available | View in JSpectraViewer |
|---|
| 1D NMR | 1H NMR Spectrum (1D, 800 MHz, H2O, predicted) | Not Available | View in JSpectraViewer |
|---|
| 1D NMR | 13C NMR Spectrum (1D, 900 MHz, H2O, predicted) | Not Available | View in JSpectraViewer |
|---|
| 1D NMR | 1H NMR Spectrum (1D, 900 MHz, H2O, predicted) | Not Available | View in JSpectraViewer |
|---|
|
|---|
| |
| Adipose Tissue | Detected and Quantified | 1193.66 nmol/g of tissue | Not Specified | Not Specified | Normal | | details | | Adipose Tissue | Detected and Quantified | 1162.0684 nmol/g of tissue | Not Specified | Not Specified | Normal | | details | | Adipose Tissue | Detected and Quantified | 8364.74 nmol/g of tissue | Not Specified | Not Specified | Normal | | details | | Adipose Tissue | Detected and Quantified | 11295.00121 nmol/g of tissue | Not Specified | Not Specified | Normal | | details | | Adipose Tissue | Detected and Quantified | 57519.34 nmol/g of tissue | Not Specified | Not Specified | Normal | | details | | Adipose Tissue | Detected and Quantified | 62964.55 nmol/g of tissue | Not Specified | Not Specified | Normal | | details | | Adipose Tissue | Detected but not Quantified | Not Quantified | Not Specified | Not Specified | Normal | | details | | Adipose Tissue | Detected but not Quantified | Not Quantified | Not Specified | Not Specified | Normal | | details | | Adipose Tissue | Detected but not Quantified | Not Quantified | Not Specified | Not Specified | Normal | | details | | Adipose Tissue | Detected and Quantified | 67592.94 nmol/g of tissue | Not Specified | Not Specified | Normal | | details | | Adipose Tissue | Detected and Quantified | 56857.59 nmol/g of tissue | Not Specified | Not Specified | Normal | | details | | Adipose Tissue | Detected and Quantified | 64624.15 nmol/g of tissue | Not Specified | Not Specified | Normal | | details | | Adipose Tissue | Detected and Quantified | 54233.39 nmol/g of tissue | Not Specified | Not Specified | Normal | | details | | Adipose Tissue | Detected but not Quantified | Not Quantified | Not Specified | Not Specified | Normal | | details | | Adipose Tissue | Detected but not Quantified | Not Quantified | Not Specified | Not Specified | Normal | | details | | Adipose Tissue | Detected but not Quantified | Not Quantified | Not Specified | Not Specified | Normal | | details | | Adipose Tissue | Detected but not Quantified | Not Quantified | Not Specified | Not Specified | Normal | | details | | Adipose Tissue | Detected but not Quantified | Not Quantified | Not Specified | Not Specified | Normal | | details | | Liver | Detected but not Quantified | Not Quantified | Not Specified | Not Specified | Normal | | details | | Milk | Detected but not Quantified | Not Quantified | Not Specified | Not Specified | Normal | | details | | Milk | Detected and Quantified | 9277.462 uM | Not Specified | Not Specified | Normal | | details | | Milk | Detected and Quantified | 10161.0302 uM | Not Specified | Not Specified | Normal | | details | | Milk | Detected and Quantified | 10602.814 uM | Not Specified | Not Specified | Normal | | details | | Milk | Detected and Quantified | 16346.00517 uM | Not Specified | Not Specified | Normal | | details | | Milk | Detected and Quantified | 1325.352 +/- 441.784 uM | Not Specified | Not Specified | Normal | | details | | Milk | Detected and Quantified | 176.714 uM | Not Specified | Not Specified | Normal | | details | | Milk | Detected and Quantified | 132.535 uM | Not Specified | Not Specified | Normal | | details | | Milk | Detected and Quantified | 176.714 uM | Not Specified | Not Specified | Normal | | details | | Milk | Detected and Quantified | 2164.741 uM | Not Specified | Not Specified | Normal | | details | | Milk | Detected but not Quantified | Not Quantified | Not Specified | Not Specified | Normal | | details | | Milk | Detected but not Quantified | Not Quantified | Not Specified | Not Specified | Normal | | details | | Placenta | Expected but not Quantified | Not Quantified | Not Specified | Not Specified | Normal | | details |
|
|---|
| General References | - Soyeurt H, Dardenne P, Dehareng F, Lognay G, Veselko D, Marlier M, Bertozzi C, Mayeres P, Gengler N: Estimating fatty acid content in cow milk using mid-infrared spectrometry. J Dairy Sci. 2006 Sep;89(9):3690-5. doi: 10.3168/jds.S0022-0302(06)72409-2. [PubMed:16899705 ]
- Jensen RG: The composition of bovine milk lipids: January 1995 to December 2000. J Dairy Sci. 2002 Feb;85(2):295-350. doi: 10.3168/jds.S0022-0302(02)74079-4. [PubMed:11913692 ]
- Trimigno A, Munger L, Picone G, Freiburghaus C, Pimentel G, Vionnet N, Pralong F, Capozzi F, Badertscher R, Vergeres G: GC-MS Based Metabolomics and NMR Spectroscopy Investigation of Food Intake Biomarkers for Milk and Cheese in Serum of Healthy Humans. Metabolites. 2018 Mar 23;8(2). pii: metabo8020026. doi: 10.3390/metabo8020026. [PubMed:29570652 ]
- van Gastelen S, Antunes-Fernandes EC, Hettinga KA, Dijkstra J: Relationships between methane emission of Holstein Friesian dairy cows and fatty acids, volatile metabolites and non-volatile metabolites in milk. Animal. 2017 Sep;11(9):1539-1548. doi: 10.1017/S1751731117000295. Epub 2017 Feb 21. [PubMed:28219465 ]
- Kurt J. Boudonck, Matthew W. Mitchell, Jacob Wulff and John A. Ryals (2009). Kurt J. Boudonck, Matthew W. Mitchell, Jacob Wulff and John A. Ryals. Characterization of the biochemical variability of bovine milk using metabolomics. Metabolomics (2009) 5:375?386. Metabolomics.
- M.J. Abarghuei, Y. Rouzbehan, A.Z.M Salem, M.J. Zamiri (2014). M.J. Abarghuei, Y. Rouzbehan, A.Z.M Salem, M.J. Zamiri. Nitrogen balance, blood metabolites and milk fatty acid composition of dairy cows fed pomegranate-peel extract. Livestock Science (2014) 164:72-80 doi: 10.1016/j.livsci.2014.03.021. Livestock Science.
- Fooddata+, The Technical University of Denmark (DTU) [Link]
|
|---|